Week 3 - Technical Indicators and Chart Settings
Saving multiple Styles and Study Sets on Thinkorswim makes it fast and easy to add additional charts and change layouts without needing to change preferences or time frames.
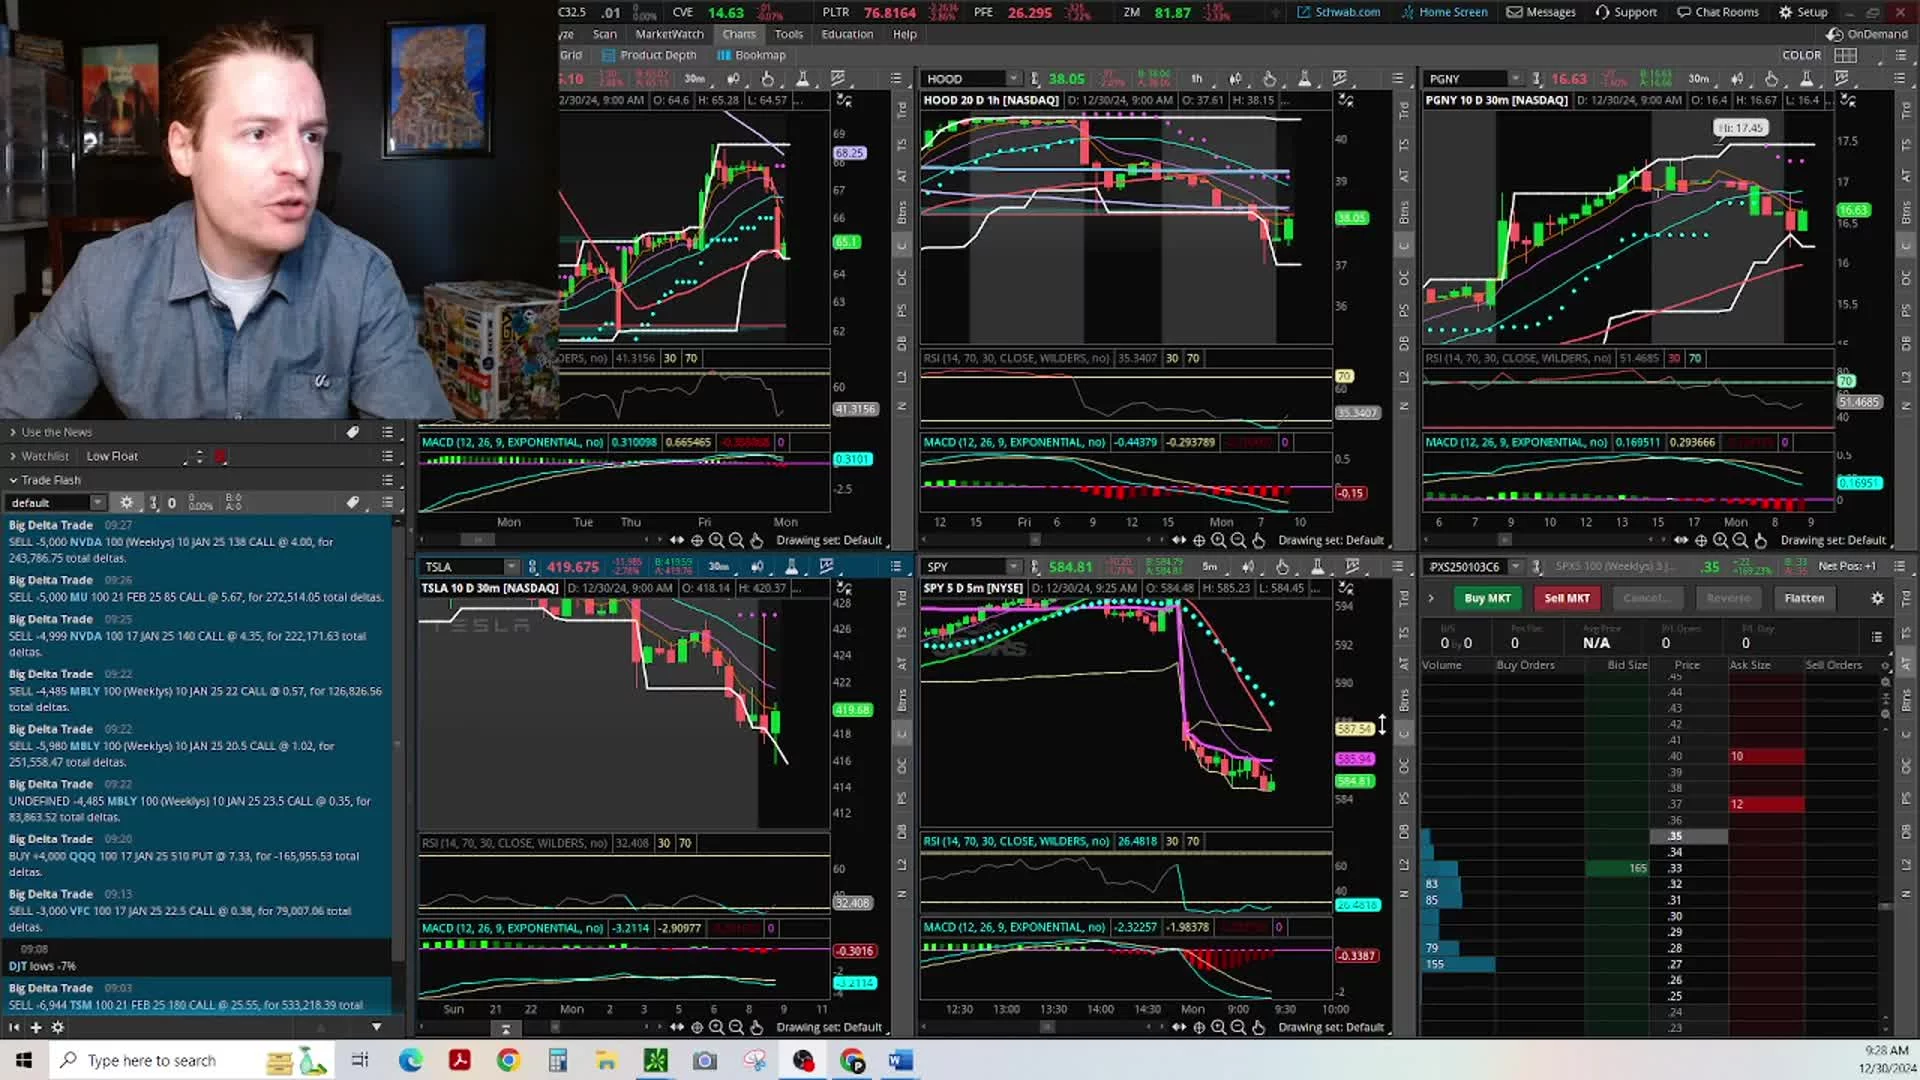
In this video we will discuss VWAP, Volume Profile, Appearance, Time Frame, Appearance of Indicators, Scanning for Stocks and Level II data
Previous
Week 4 - Reward to Risk on Vertical Spreads
Next